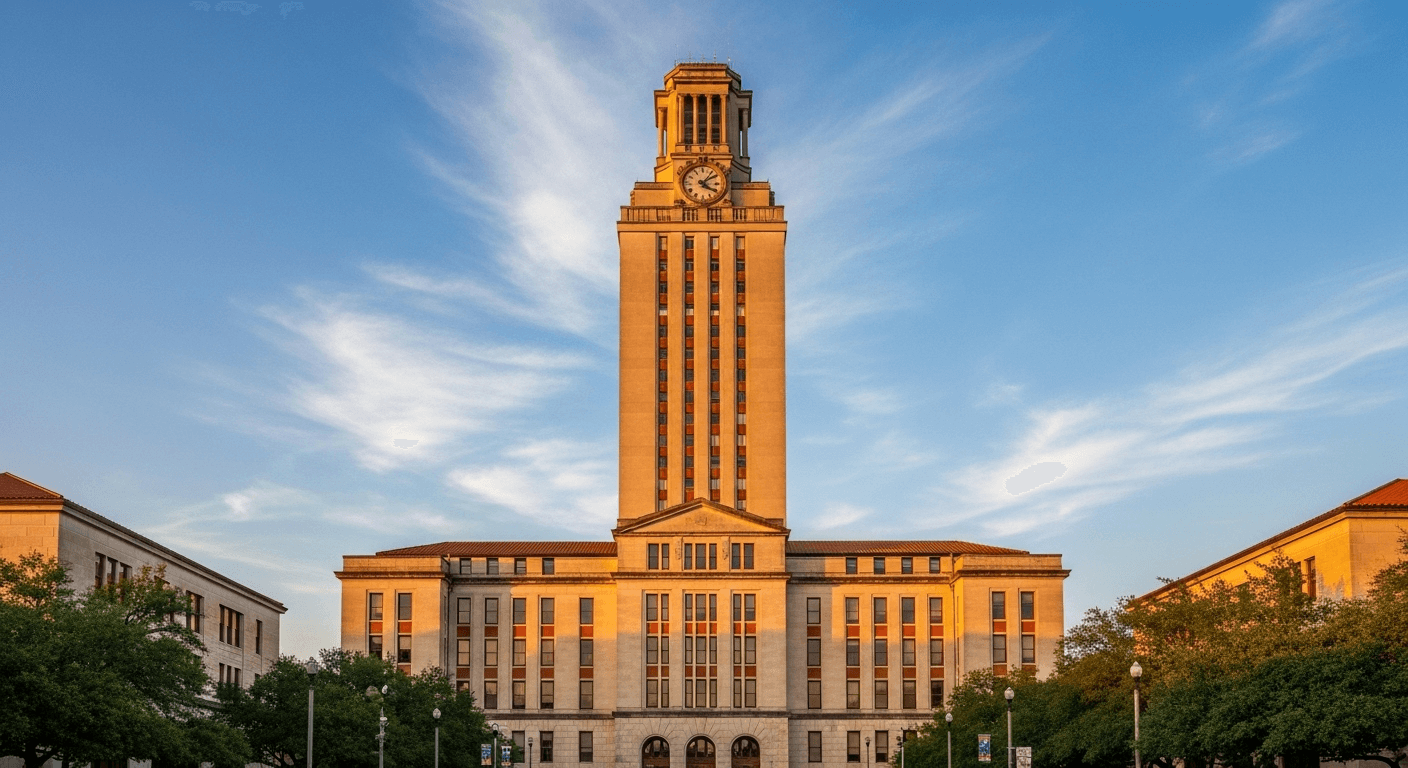
UT Austin · OOS percentage explained
UT Austin Out-of-State Percentage
UT Austin caps non-resident undergraduate enrollment at approximately 10% of the entering class by Texas state law and Board of Regents policy. This means approximately 850-1,000 non-resident freshmen admitted per year out of ~8,500-9,000 total. OOS acceptance rate: approximately 8-13% (materially lower than 31% overall rate). Non-residents compete in a small holistic-review pool while Texas Top 10% Rule auto-admits consume ~75% of in-state seats.
The 10% cap in numbers
- Total undergraduate enrollment: ~42,000 students
- OOS undergraduate students: ~4,200 (10% of enrollment)
- Entering freshman class size: ~8,500-9,000 per year
- OOS freshman admits per year: ~850-1,000
- Texas Top 10% Rule auto-admits: ~75% of in-state seats (~5,700-6,000 auto-admits per year)
- Holistic review pool: remaining ~25% of in-state seats + 10% of OOS seats = ~1,900-2,300 seats via holistic review
Why the cap exists
UT Austin is a state institution. Texas Constitution establishes UT as serving Texas residents primarily. State law and Board of Regents policy limit non-resident enrollment to protect access for Texas residents. The Top 10% Rule further guarantees admission to the top percentage of Texas high school graduates.
The 10% cap is not arbitrary; it reflects:
- Constitutional intent that UT serves Texas primarily
- Political pressure to maintain access for Texas residents
- Higher tuition revenue from non-residents (but capped to prevent over-reliance on OOS revenue)
- Diversity considerations (some geographic diversity is valued)
Top OOS feeder states (approximate order)
| Rank | State | Approximate Annual OOS Freshmen |
|---|---|---|
| 1 | California | ~120-150 |
| 2 | New York | ~80-100 |
| 3 | Illinois | ~50-70 |
| 4 | Florida | ~50-70 |
| 5 | Georgia | ~40-60 |
| 6 | New Jersey | ~40-55 |
| 7 | Massachusetts | ~30-45 |
| 8 | Virginia | ~30-45 |
| 9 | Colorado | ~25-40 |
| 10 | Maryland | ~25-40 |
| 11 | Washington | ~25-40 |
| 12 | Connecticut | ~20-35 |
| 13 | Arizona | ~20-35 |
| 14 | Tennessee | ~20-30 |
| 15 | Pennsylvania | ~20-30 |
These numbers are approximate based on UT enrollment reporting. Detailed guides for each origin state at /by-state.
How the cap affects OOS acceptance rate
The 10% cap combined with ~10,000-12,000 annual OOS applications produces OOS acceptance rate of approximately 8-13%. Non-residents compete in a small, competitive pool where every seat matters. Selective UT programs (McCombs, CS, Cockrell ECE) see even lower OOS rates due to program-specific competition.
What the 10% cap means for OOS applicants
- Academic profile must be strong: top 5% of class, SAT 1450+ or ACT 33+, substantial extracurricular depth
- Essay quality matters: in a small competitive pool, essays differentiate applicants
- Major choice matters: less-selective UT colleges (Liberal Arts, Education) have higher OOS acceptance than McCombs, CS, Cockrell ECE
- Apply by November 1 priority deadline: maximizes admissions and scholarship consideration
- Complete UT Honors and Scholarship Application: unlocks institutional merit aid
Frequently asked questions
What percentage of UT Austin students are out-of-state?
Why is UT Austin's OOS percentage so low?
What states send the most students to UT Austin?
How does the 10% cap affect OOS acceptance rate?
Do international students count against the 10% cap?
Talk to Luke
Your situation is specific. Get a written answer.
The site covers the general case. If your circumstances do not quite fit — divorce, military, scholarship interactions, late timing, prior denial — send a message. Luke replies personally, usually within one business day.
Or send a message and Luke will reply in writing: